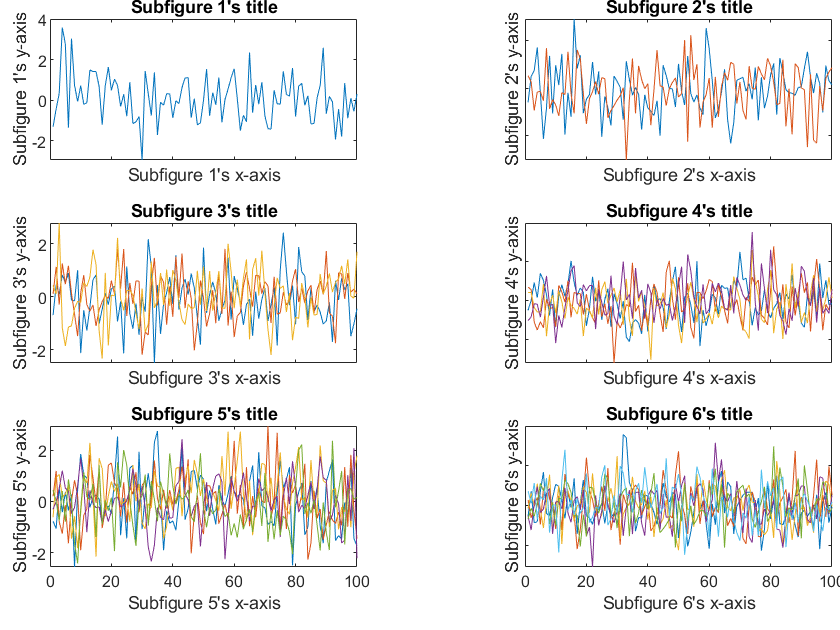
调整子图块间距tight_subplot
%% Initialization
clear all;
close all;
clc;

%% 输入tight_plot函数的参数,予之赋值
TightPlot.ColumeNumber = 3;     % 子图列数
TightPlot.RowNumber = 2;    % 子图行数
TightPlot.GapW = 0.2;  % 子图之间的左右间距
TightPlot.GapH = 0.1;   % 子图之间的上下间距
TightPlot.MarginsLower = 0.1;   % 子图与图片上方的间距
TightPlot.MarginsUpper = 0.03;  % 子图与图片下方的间距
TightPlot.MarginsLeft = 0.06;   % 子图与图片左方的间距
TightPlot.MarginsRight = 0.01;  % 子图与图片右方的间距

%% 开始绘图
figure(1);
p = tight_subplot(TightPlot.ColumeNumber,TightPlot.RowNumber,...
    [TightPlot.GapH TightPlot.GapW],...
    [TightPlot.MarginsLower TightPlot.MarginsUpper],...
    [TightPlot.MarginsLeft TightPlot.MarginsRight]);

for i = 1:6 %输出6个图
	axes(p(i));%创建坐标系图形对象,相当于figure
	subp{i} = plot(randn(100,i));% 出图
    title(sprintf('Subfigure %d''s title',i)); % 子图i的标题
    xlabel(sprintf('Subfigure %d''s x-axis',i));   % 子图i的横轴标题
    ylabel(sprintf('Subfigure %d''s y-axis',i));   % 子图i的纵轴标题
end
set(p(1:4),'XTickLabel','');    % 抹去子图1-4的横轴数值
set(p([2,4,6]),'YTickLabel','') % 抹去子图2、4、6的纵轴数值

「真诚赞赏,手留余香」
真诚赞赏,手留余香
使用微信扫描二维码完成支付

comments powered by Disqus